Stats
The Stats tab builds up over the course of your season. It draws on every completed game to show how fairly the squad is being used, which player combinations win, and much more.
Stats only appear for completed games (all four quarters ended). In-progress game data is excluded.
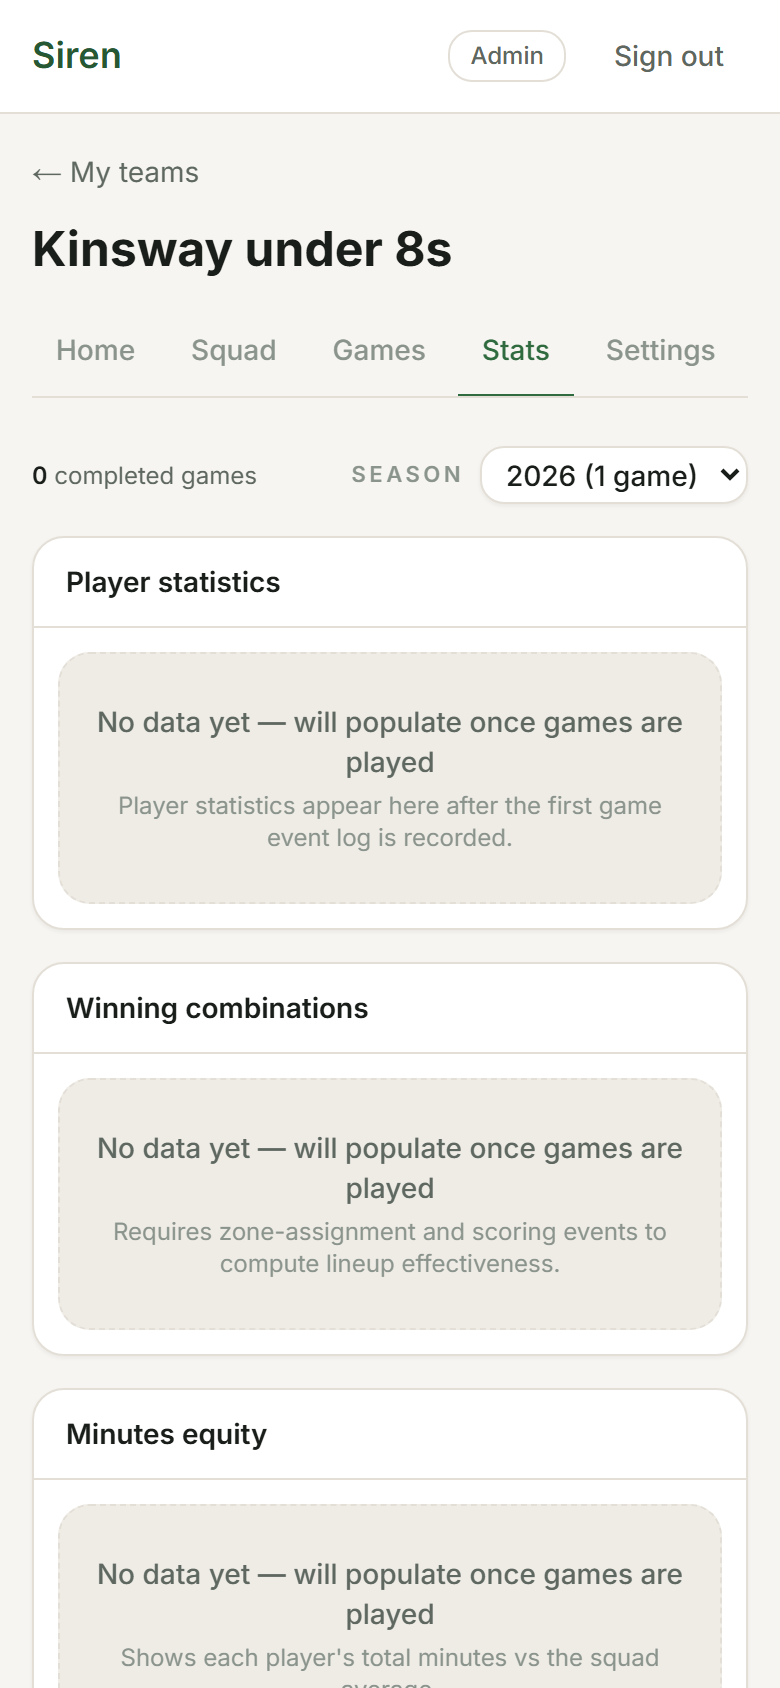
Player stats
A table showing every player's totals across the season:
- Total games played
- Total minutes on the playing area (excluding bench time)
- Minutes per position area — football breaks down by zone (FORWARD / CENTRE / BACK and the half-zones); netball breaks down by third (Attack / Centre / Defence) with per-position GS / GA / etc. percentages
- Scoring totals (if scoring was tracked)
Needs: At least one completed game. Scoring columns only populate if Track scoring was on.
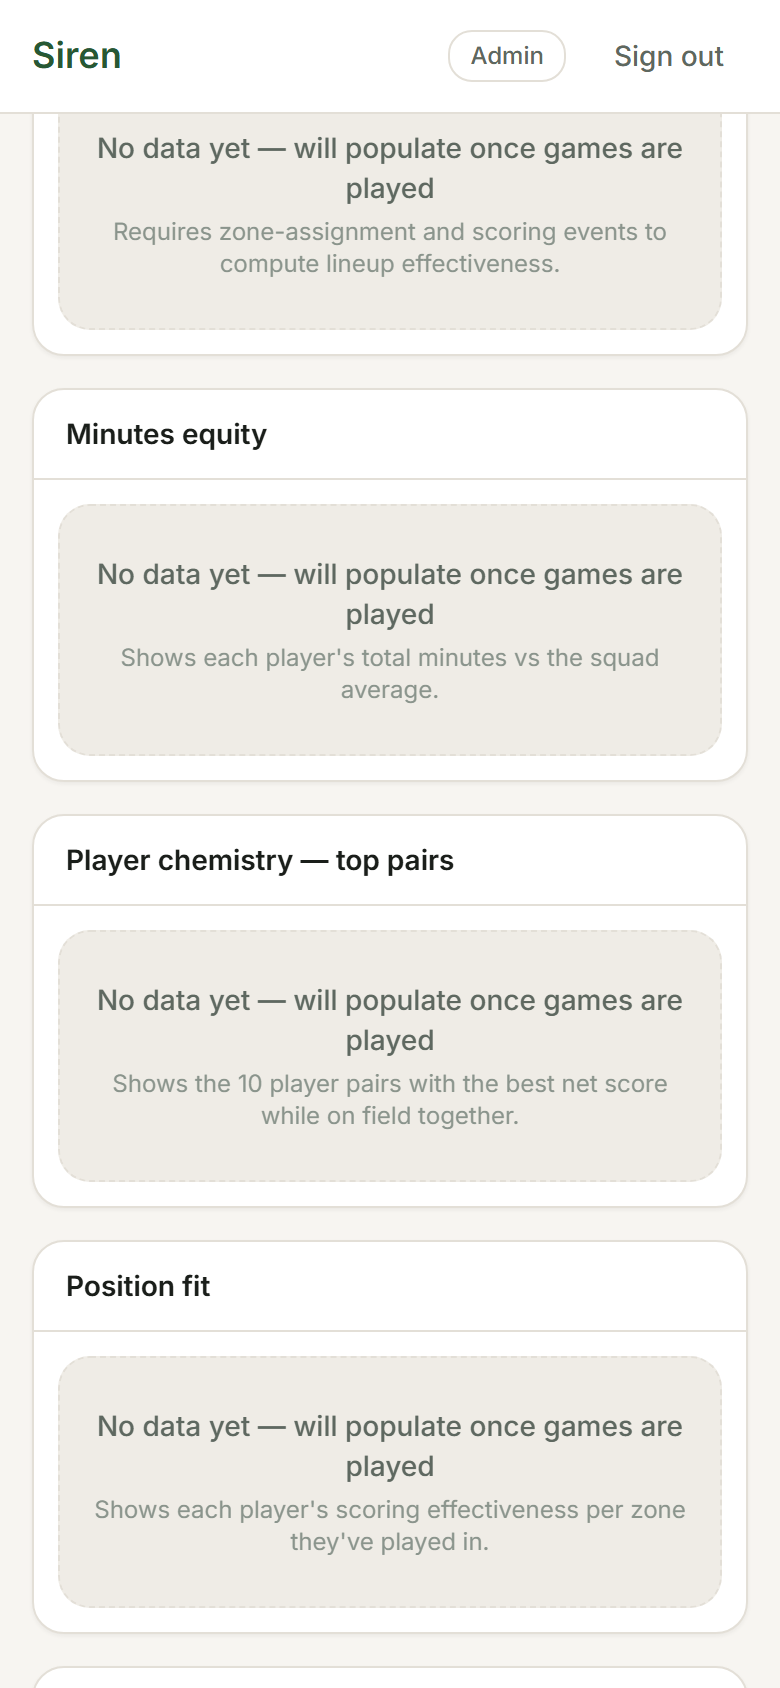
Minutes equity
A visual breakdown of how total minutes on the playing area are distributed across the squad. An even spread means every player is getting similar game time. The coloured bars match the position colour coding used in the live view.
Needs: At least one completed game with rotation data (games that were started and ended properly).
Winning combinations
Shows which player groupings have the best win rate when on the playing area together in the same area. Combinations are ranked by position and filtered to pairs/trios that have played enough together to be meaningful.
Needs: Multiple completed games with scoring tracked, so the app has enough win/loss data per combination.
Player chemistry
Measures how often two players are on the playing area at the same time and how the team performs during those stints. High chemistry scores suggest a pairing that works well together.
Needs: Multiple games with rotation and scoring data.
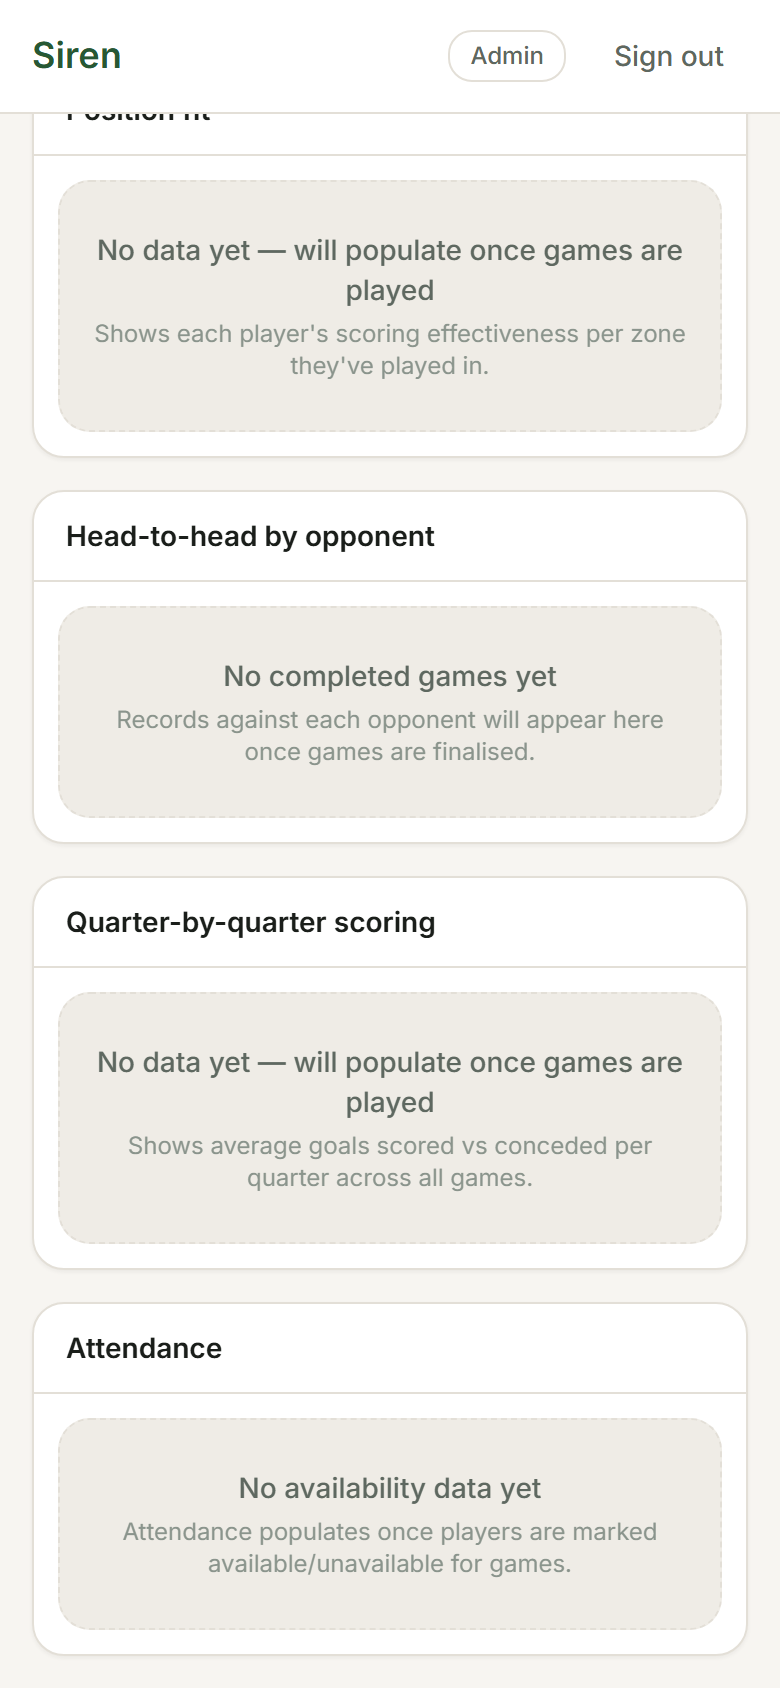
Position fit
Rates each player's effectiveness in each position, based on how the team performs while they're there. Use this to identify which players thrive in which positions.
Needs: Multiple completed games with scoring enabled.
Head-to-head
Compare any two players directly: their per-position minute split, scoring totals, and win rate when on the playing area together vs. apart.
Needs: At least two completed games involving both players.
Quarter-by-quarter scoring
A breakdown of how your team's scoring changed across each quarter of the season. Useful for identifying patterns. For example, if you consistently leak goals in Q3.
Needs: Completed games with scoring tracked.
Attendance
A table showing each player's attendance record across the season: how many games they were marked available and how many they missed.
Needs: At least one completed game with availability marked.
Season selector
At the top of the Stats tab, a season selector lets you switch between years if you have game data from multiple seasons.